Customer Segmentation Using Kmeans Clustering in Python
Segmenting customers for better marketing


Table of Contents
Introduction
Business Scenario
Exploring Dataset
Data Preprocessing
K-Means Segmentation
K-Means visualization
Conclusion
Introduction
Customer segmentation is grouping customers into distinct categories with the same features. The process makes it easier to target a particular group of clients with tailored marketing strategies, services, and products.
Customer segmentation is important since it assists in optimizing marketing strategies that enhance sales, customer retention, satisfaction, and experience.
Business Scenario
Suppose we are working as data scientists for a supermarket and would like to assist the marketing department in introducing new products and improve sales based on customer segmentation. Therefore, we will save our money and time by marketing a particular group of clients with certain products.
How was the data collected?
The data was obtained from customers' loyalty card
We will use KMeans clustering to define the new group of customers.
Understanding data is essential.
Before working on any project, it is important to understand the business problem and the dataset.
What are the variables in the dataset
CustomerID: Uniquely identifies the customer
Gender: Biological sex of a customer. In the scenario, there are two options.
Male and Female
Age: The age of the customer in years
The minimum age is 18 years, and the maximum age is 70.
Annual income: The annual income of customers in US dollars
The highest customer income is 137 US dollars while the lowest income is 15 US dollars.
Spending Score: The spending score of customers on a scale of 1 to 100
The highest customer spending score is 99, and the lowest spending score is 1.
Importing Libraries
In this project, we will need some libraries to help us along the way
## Data Analysis
import pandas as pd
## Data Visualization
import seaborn as sn
import matplotlib.pyplot as plt
from sklearn.cluster import KMeans
import warnings
warnings.filterwarnings("ignore")
Exploring Dataset
df=pd.read_csv("C:/Users/User/Documents/DATA ANALYST/Datasets/Mall_Customers.csv")
The section entails data understanding to assist in descriptive analysis and data visualization.
df.head()
Describe method can also be applied to see the columns' descriptive statistics.
df.describe()
| CustomerID | Age | Annual Income (k$) | Spending Score (1-100) | |
| count | 200.000000 | 200.000000 | 200.000000 | 200.000000 |
| mean | 100.500000 | 38.850000 | 60.560000 | 50.200000 |
| std | 57.879185 | 13.969007 | 26.264721 | 25.823522 |
| min | 1.000000 | 18.000000 | 15.000000 | 1.000000 |
| 25% | 50.750000 | 28.750000 | 41.500000 | 34.750000 |
| 50% | 100.500000 | 36.000000 | 61.500000 | 50.000000 |
| 75% | 150.250000 | 49.000000 | 78.000000 | 73.000000 |
| max | 200.000000 | 70.000000 | 137.000000 | 99.000000 |
The describe method is used in numerical methods. The mean of Age and Annual Income is 38.85 and 60.56, respectively.
Correlation Analysis
An effective way of understanding the relationship between variables is through correlation analysis.
We determine the correlation between the variables using corr method.
sn.heatmap(dff.corr(),annot=True, cmap="coolwarm")

There is a weak negative correlation between age and the annual income of the customers.
The next step is segmentation, however, it is important to scale data first
Data Preprocessing
Standardization is important before applying K-Means
We want to treat every feature equally through feature transformation where the values fall within the [0:1] range.
The process is known as standardization.
from sklearn.preprocessing import StandardScaler
Scale= StandardScaler()
| CustomerID | Age | Annual Income (k$) | Spending Score (1-100) | Income Cluster | Spending and Income Cluster | Gender_Male | |
| 0 | 1 | 19 | 15 | 39 | 1 | 2 | True |
| 1 | 2 | 21 | 15 | 81 | 1 | 1 | True |
| 2 | 3 | 20 | 16 | 6 | 1 | 2 | False |
| 3 | 4 | 23 | 16 | 77 | 1 | 1 | False |
| 4 | 5 | 31 | 17 | 40 | 1 | 2 | False |
There are 5 clusters
KMeans Segmentation
inertia_scores =[]
for i in range(1,11):
    kmeans=KMeans(n_clusters = i)
    kmeans.fit(df[["Annual Income (k$)"]])
    inertia_scores.append(kmeans.inertia_)
inertia_scores
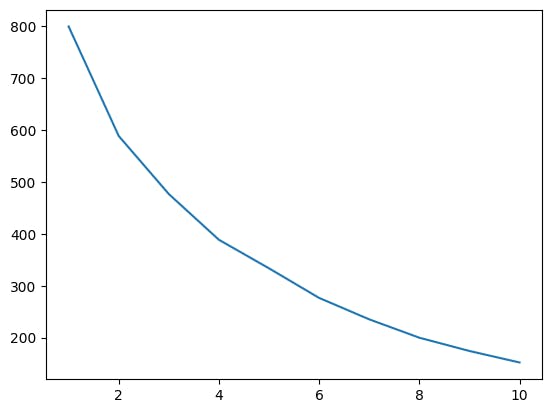
The elbow in the graph is the five-cluster mark. This is the only place until the graph steeply declines while smoothing out afterward.
Let’s perform K-Means clustering with 5 clusters.
KMeans Visualization
plt.figure(figsize=(10,8))
plt.scatter(x=centers["x"],y=centers["y"],s=100,c="black",marker="*")
sn.scatterplot(data=df, x="Annual Income (k$)", y="Spending Score (1-100)",hue= "Spending and Income Cluster",palette="tab10")
plt.savefig("clustering bivariate.png")

Conclusion
The target group would be cluster 1 which has a high spending score and high income.
54 percent of cluster 1 shoppers are women.
We should look for ways to attract these customers using a marketing campaign targeting popular items in this cluster.
Cluster 2 presents an interesting opportunity to market to the customers for sales event on popular items.
If you want to see the entire code in Jupyter Notebook, it can be found on my https://github.com/lucyadhiambo58/Shopping-Customer-Segmentation
Thank you for reading.